Some call it a “plandemic.” They point to Event 201 that took place in 2019 where they simulated a pandemic and the world-wide response. What a coincidence that just a few months later there was a real pandemic, they point out.
Some call it a “scamdemic.” They point to the lack of scientific evidence of the existence of a new virus and to the meaninglessness of a “test” that uses indirect evidence to prove the existence of a virus when there is no gold standard against which to validate the test.
Both labels have their merits. The plandemic argument focuses on the political and economic dimension. The scamdemic argument focuses on the scientific dimension. But there is a simpler argument still – the argument for the “casedemic.” You don’t need to know a thing about politics, economics or science to understand the argument for the “casedemic.” You just need to apply some simple mathematical logic.
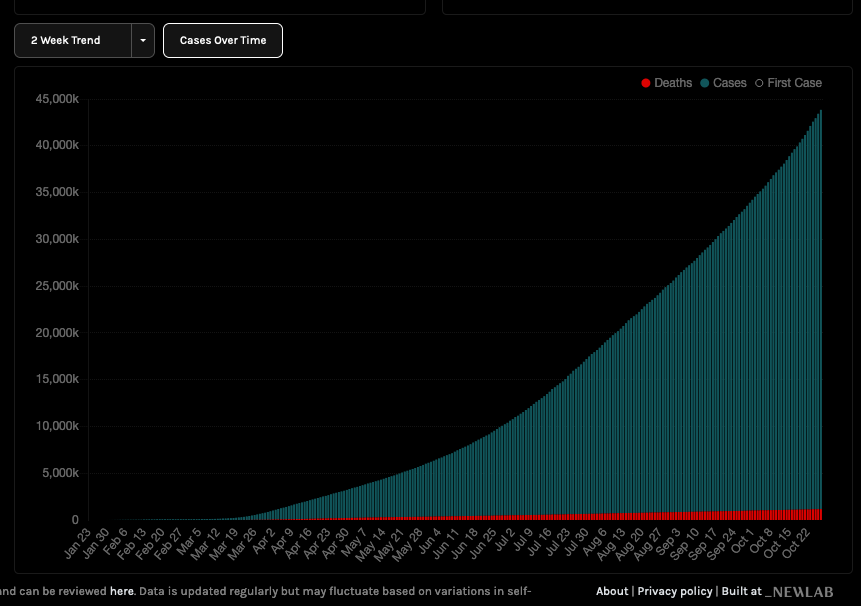
The graph below is taken from The Covid-19 Tracker

It is a simple graph of the total number of cases and the total number deaths from Covid, both plotted against time.
The number of deaths is a straight line. The number of cases is NOT a straight line. It’s an exponential curve. If the deaths from Covid were related to the number of cases, the shape of the two curves would be similar and deaths should follow cases. They would either both be linear or both be exponential curves. However, the two curves seem unrelated to each other.
Obviously, the discrepancy has to do with the increasing amount of testing being done. More testing will result in more “cases,” not in more deaths, as the graph clearly shows. We are seeing a casedemic, not a pandemic.
In the start of this whole fiasco the WHO directed the world to “test, test, test.” The world, to a large extent, followed these orders. What was the WHO’s motivation. Apparently, to scare you. The media is happy to play along. Boo! Don’t fall for it.
The inventor of the technology behind the “test” (actually it is more accurately described as a manufacturing process) knew it was being used incorrectly back in the day of AIDS. He addressed the casedemic issue then:
The number of cases went up exponentially because the number of tests that were done went up exponentially. How many doctors knew about HIV in 1983? Two. How many knew about it in 1985? About 500. How many knew about it in 1986? Forty thousand. So, that’s where the curve came from.
– Kary Mullis
History is repeating itself.
If testing stopped tomorrow the number of cases would go to zero. So, let’s do that and it will mean the end of the pandemic. That’s logical, right? Well, it’s just as logical as thinking that an increasing number of cases means we are all in serious danger from a virus.
Source:
Further Reading: